
One test. Two timelines.
Most leaf analysis gives you one number, against a fixed norm, on the day it was sampled. That can't tell you whether the plant is building reserves, already short, or about to need correction. DRIS reads tissue and sap together, what the plant has stored, and what's moving through it right now, in a single report.
The problem with a fixed norm
Why sap can't have a fixed norm.
Sap moves. Sample the same leaf at 8am, 10am and noon and you'll get three different readings, because what's flowing through the plant shifts by the hour with temperature, transpiration and sunlight. A fixed "sap norm" doesn't exist, which is why most systems avoid sap analysis altogether, or use it loosely.
DRIS doesn't compare your reading to a fixed number. It compares every element in the sample to every other element, at that moment, so the balance holds steady even though the raw numbers move all day. It's one of the only ways to read sap with confidence: you're judging relationships, not a snapshot.
Tissue · the record
What the plant has stored.
Tissue holds 3–4 weeks of growth. It shows what the plant has already taken up and built into its structure.
Sap · the leading edge
What's moving right now.
Sap shows what's currently available and in flow, a leading indicator of what the next leaf, the next flush, will look like.
Why reading them together matters.
Low + Low
Genuinely short, and still short.
Low tissue + High sap
Was short, now recovering. A correction is working.
High tissue + Low sap
Reserves are fine, but demand has outpaced supply, often a sign the element needs to be made available, not applied again.
No other method puts tissue and sap on one graph. That's what makes the next leaf predictable instead of a surprise.
Nitrogen · reading the forms
Why four forms tell you more than one number.
Standard leaf analysis reports total nitrogen as a single figure. Sap splits it into four, and that split matters, because a crop can carry plenty of nitrogen and still be short on the nitrogen it can actually use.
Raw · unconverted
Nitrate NO₃
Closer to undigested carbohydrate than usable nitrogen.
Ammonium NH₄
Also raw: must be converted before the plant can build with it.
Usable · what the plant builds with
Organic nitrogen
The amino acids and proteins the plant actually grows with. This is the share that does the work.
When energy is short, nitrate and ammonium pile up unconverted. Total tissue nitrogen can still read normal, or even high, because the test sums every form together. What it hides is that the usable share, the organic nitrogen, is low. Adding more nitrate at that point doesn't close the gap; there's already more than the plant can process.
Nitrogen conversion
index
DRIS calculates a nitrogen conversion index from the combined sap and tissue data, not just whether nitrogen is present, but how much of it has actually become protein. A low index points to what's limiting conversion, usually sulphur, molybdenum, or available energy, rather than nitrogen supply.
Reading the report
How do I read the graph?
Hover a card to find it on the report, or click to enlarge.
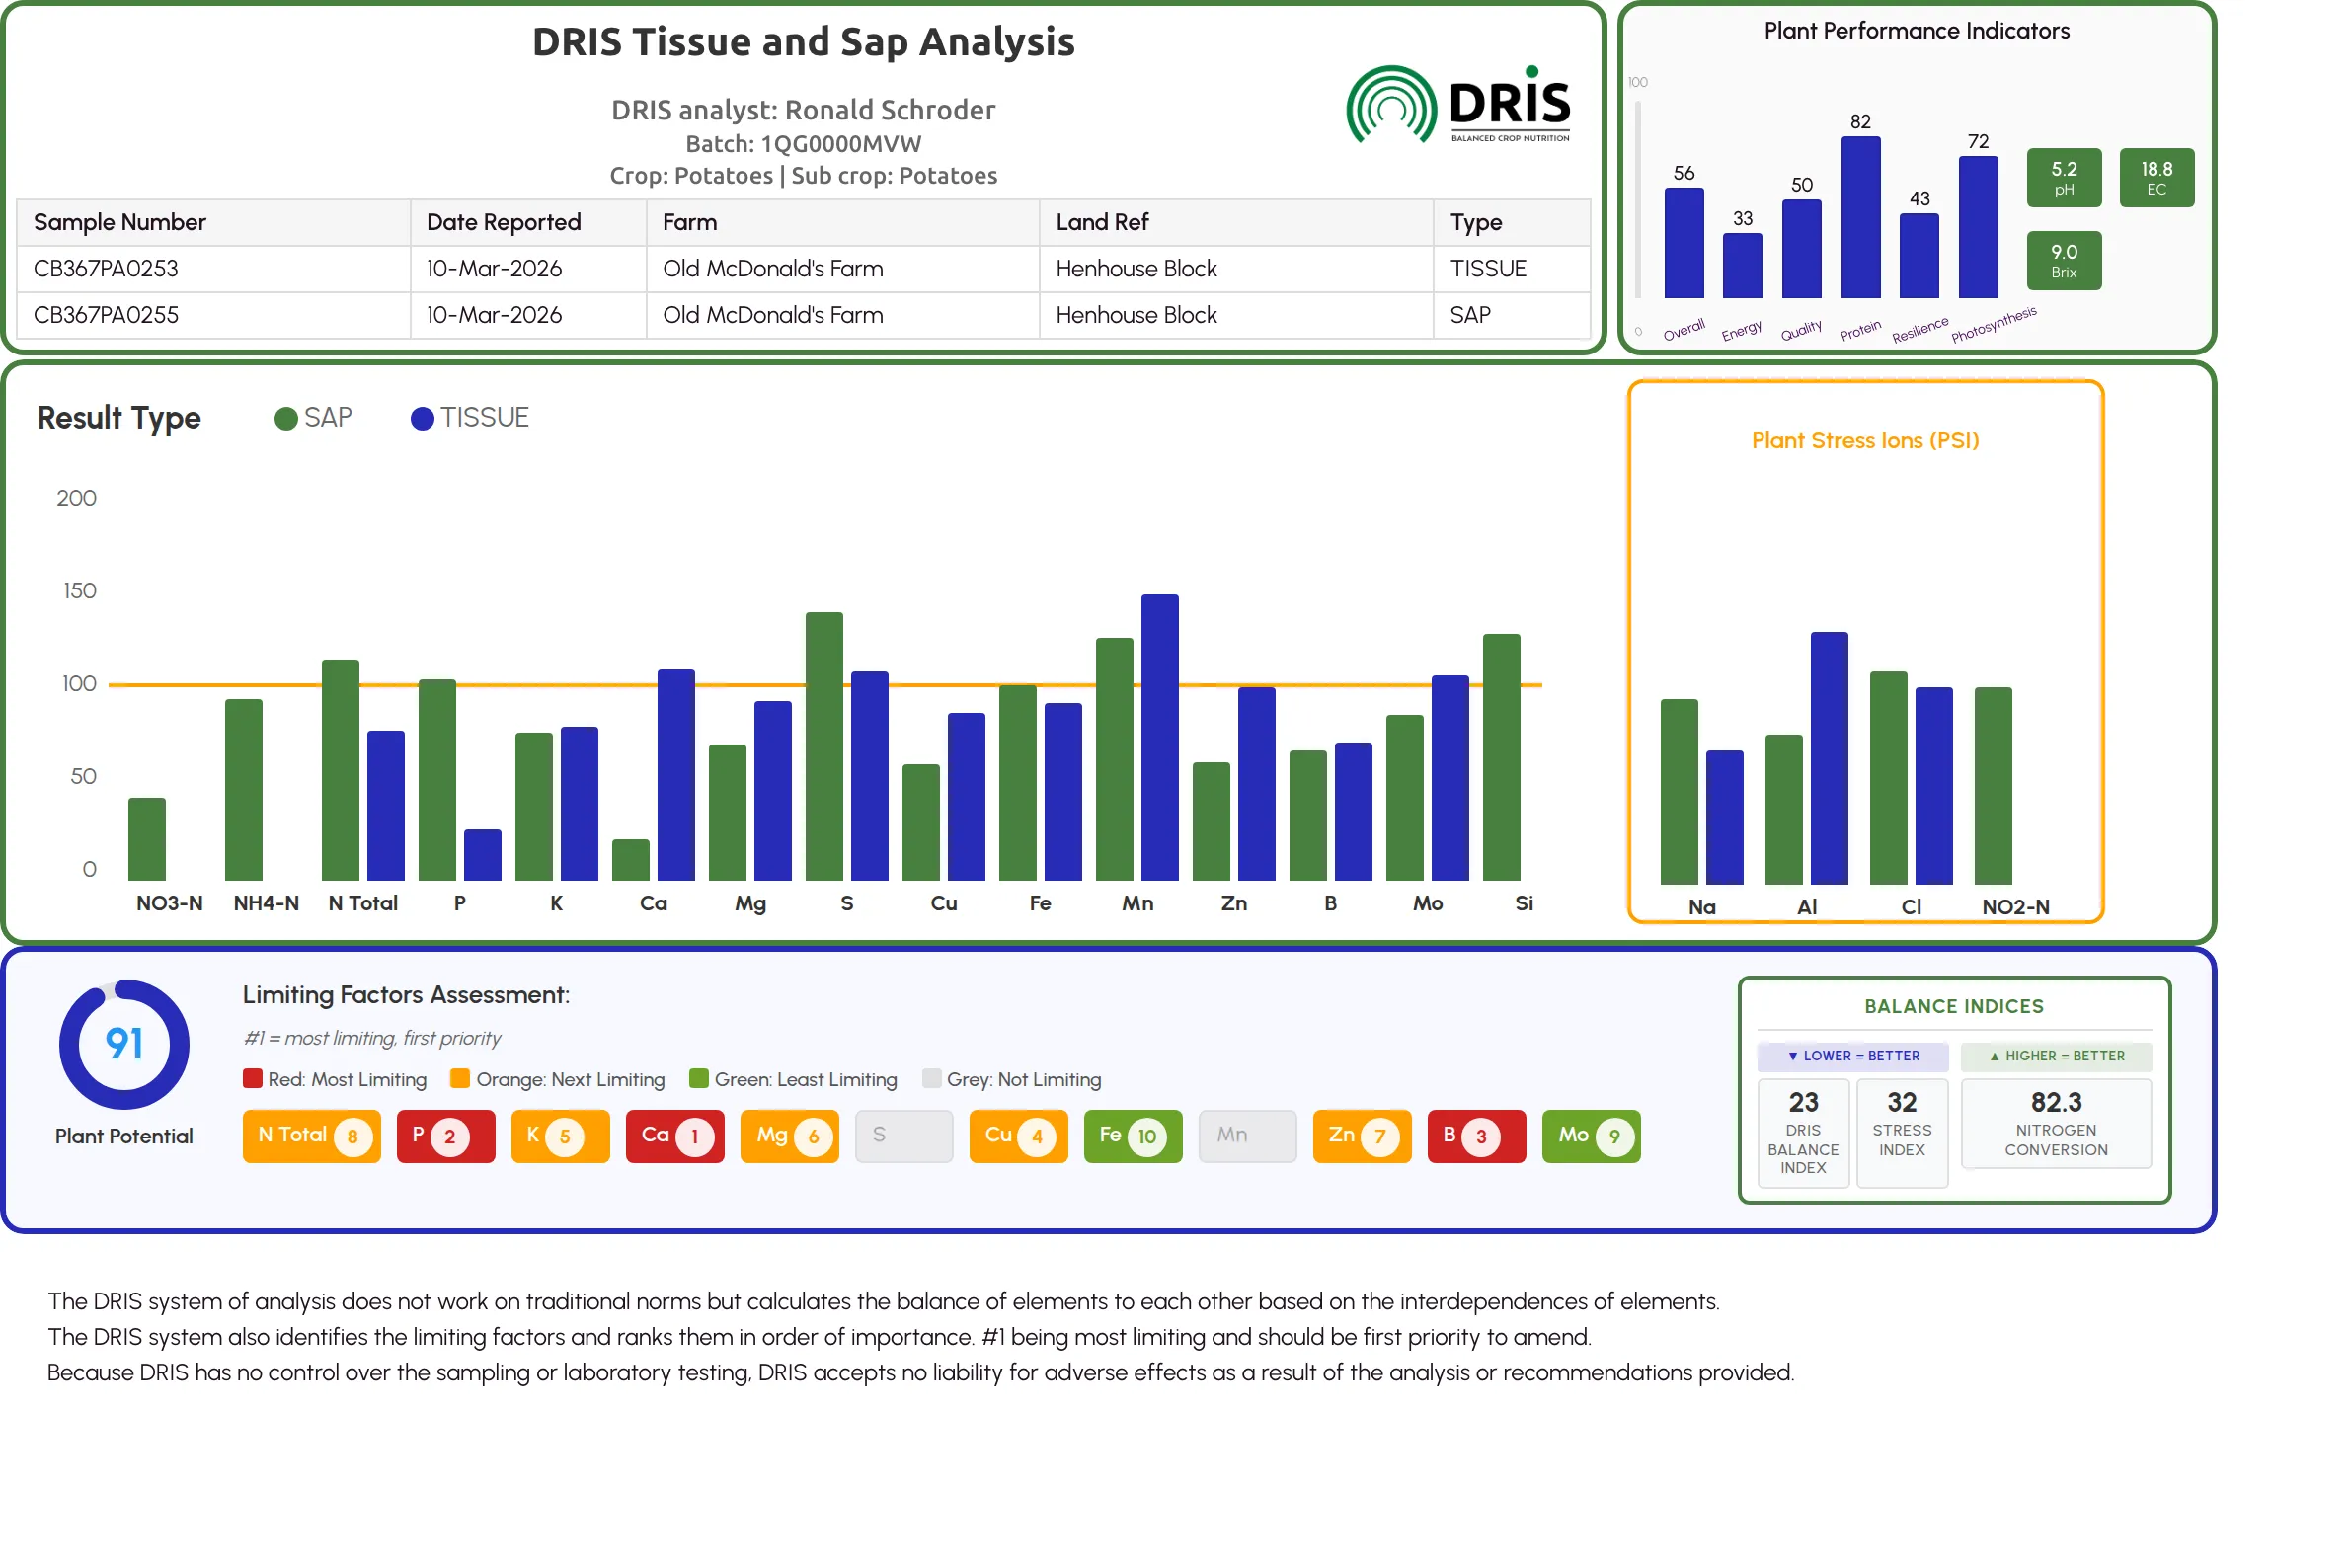
Plant Performance Indicators
Top-right. A radar of Overall, Energy, Quality, Protein, Resilience and Photosynthesis scored out of 100, with pH / EC / Brix context.
Tissue: blue bars
Centre. What the plant stored over the last 3–4 weeks; the 100% line is the balance target.
Sap: green bars
Centre. What is currently in flow and plant-available right now; read together with tissue.
Plant Stress Ions
Right panel. Na, Al, Cl and NO₂-N: elevated values indicate active stress.
Limiting Factors
Bottom-left. Priority order: red = most limiting, orange = next, green = in range / monitor, grey = not limiting.
Balance Indices
Bottom-right. Overall balance, stress and conversion indices, read as direction-of-travel; lower imbalance is better.
Read the whole plant.
Upload your existing leaf reports and we'll show you the tissue-sap balance and the limiting nutrients, free.